
Auto dealerships need more than just great cars and a well-designed showroom if they want to stay ahead in the competitive market. What they truly need is a deep understanding of their performance and the ability to track the key metric. KPI for automotive dealership helps them gain insights into their performance and what else they need in order to succeed.
In this blog, we will look at the 10 KPIs that dealerships need to track and the 5 types of KPIs. So, if you are a dealership, read on to learn how to stay on the top through tracking KPIs.
What is a KPI for Automotive Dealership?
Key Performance Indicators (KPIs) help automotive dealerships determine how much actual profit is made from each sale earned. The dealership’s ability to turn a profit on sales is shown by the greater its net profit percentage. Through KPI for automotive dealership, owners and managers can take a look into their sales process, inventory turn rate, appraisal-to-trade ratio, and more across all the departments in their dealership. Auto dealers rely on dealership performance metrics to manage their business and achieve success.
Why are KPIs Important for Automotive Dealerships?
Tracking key performance indicators (KPI) allows automotive dealerships to stay on top of their game and grow sustainably. KPI for automotive dealership provides important insights about the dealership’s performance and allows managers to make decisions that are data-driven in order to improve sales strategies and dealership operations. It also helps dealerships evaluate their performance with respect to industry standards and best practices to stay competitive. With the help of KPIs, dealerships can identify areas for improvement and work on them.

10 KPIs Automotive Dealerships Need to Track
Here’s a list of 10 metrics for car dealers to track for a car dealership that is profitable. These 10 KPI for automotive dealership give a detailed view of where they are winning and where they can improve beyond:
1) Inventory Turnover
An auto dealership’s inventory turnover rate describes how many times its full inventory turns over in a year. These are basically sale cycles and improving the turnover rate is a great way to increase profitability and for automotive inventory management.
Formula: Units sold annually ÷ Number of units in stock = Turnover rate
2) Reconditioning Time
Dealers will need to invest a significant amount of time into reconditioning units, no matter whether they are selling used or certified pre-owned vehicles. Some dealers only do touch-ups while others do extensive reconditioning.
Formula: Cumulative time spent reconditioning vehicles ÷ Number of reconditioned units = Average time spent reconditioning
3) Cost to Market
As a dealership, you will want to make a distinction between used and new vehicles to accommodate any reconditioning costs. It is important to know how much you are spending on acquiring, reconditioning, and maintaining vehicles.
Formula: Acquisition cost + Reconditioning cost + Transportation cost + Maintaining on the showroom floor cost = Cost to market
4) Gross Return on Investment
The gross return on investment (GROI) evaluates the rate of return as a percentage of the sale multiplied by the turn rate. This measurement shows how efficiently the current investment inventory is being used.
Formula: (Vehicle gross profit ÷ Cost to market) x (365 days) = GROI
5) Used to New Cehicle Sale Ratio
If a dealership’s used vehicle sales are equal to higher than new vehicle sales, this can show that the used vehicle department is strong.
Formula: Used vehicles sold ÷ New vehicles sold = Sale ratio
6) Gross Profit (or Loss) Per Vehicle
Knowing the average profit for new, used, and wholesale units sold can help dealers identify weaker categories. They can then take a deeper look at what they are stocking and come up with strategies to raise the gross profit in a specific category.
Formula: Total gross profit in that category ÷ Number of units sold in that category = Average gross profit per unit
7) Sales Per Employee
Knowing how many sales each employee brings in on average can help dealerships make staffing decisions. It will help with identifying high performers and who needs to grow.
Formula: Number of units sold ÷ Number of cars salespeople = Average unit sales per person
8) Average Unit Value
Knowing the average value of the stock on hand is a great way for dealerships to stay on top of their inventory. This can help dealers better know if they are stocking for the target they are most interested in reaching.
Formula: Value of all units in stock ÷ Number of units in stock = Average unit value
9) Wholesale Volume
The wholesale volume is the percentage of vehicles that were wholesaled. Dealerships should handle two types of wholesale stock: immediate wholesale cars that never go to retail and aged wholesale cars that are wholesaled after sitting on the lot.
Formula: Number of units wholesaled ÷ Number of units sold (retail and wholesale) = Wholesale volume
10) Conversion Rates
The KPI strategy should include the online automotive customer experience too. The digital retailing platform is just as important to the sales process as the showroom floor. Find the conversion rate and find ways to grow it.
Formula: Number of sales that started online ÷ Number of automotive eCommerce site visitors = Conversion rate

Types of KPIs for Automotive Dealerships
KPI for automotive dealership is important to measure and analyze their performance across various areas and departments of the dealership. Here are some important types of KPIs for automotive dealerships:
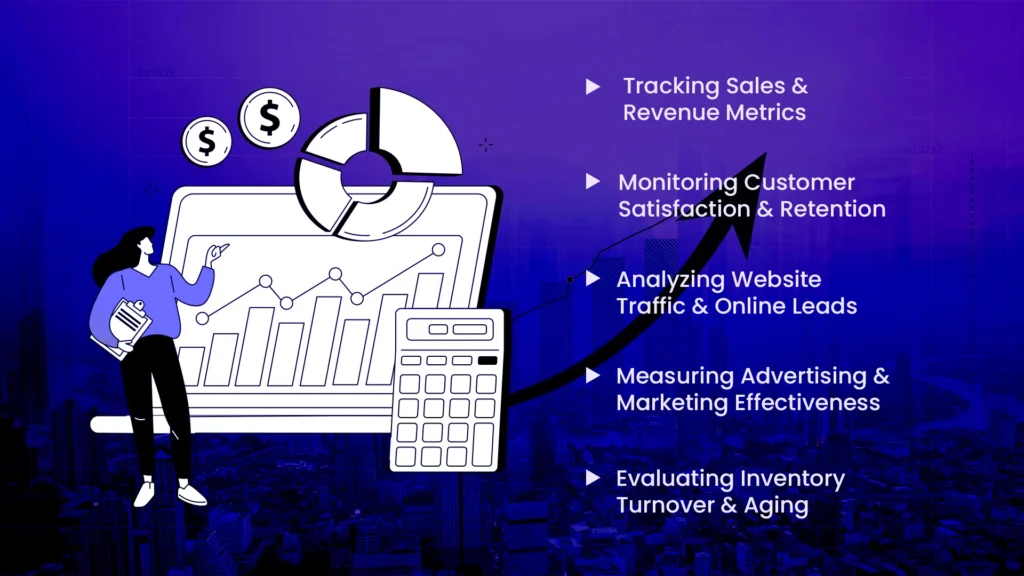
1) Tracking Sales & Revenue Metrics
Sales and revenue metrics are important for measuring a dealership’s financial performance and success. Total sales volume indicates the number of cars sold which shows the dealership’s revenue, market position, and sales team effectiveness. The average transaction value shows the average revenue per vehicle sale and offers insights into strategies for pricing and customer preferences.
2) Monitoring Customer Satisfaction & Retention
Automotive customer retention and satisfaction is important as well. Satisfied customers are more likely to return, refer others, and leave positive reviews which will help with increasing sales. The Net Promoter Score (NPS) measures customer loyalty and willingness to recommend the dealership. Customer satisfaction surveys highlight areas for improvement while online reviews and ratings show the dealership’s reputation and might influence potential buyers.
3) Analyzing Website Traffic & Online Leads
A strong online presence is important because many customers start their car-buying journey online. Website traffic volume indicates interest, while unique visitors show separate user engagement. The views on the page assess the popularity of content and the time spent on the site shows user engagement and conversion rates measure the website’s effectiveness in generating leads or sales.
4) Measuring Advertising & Marketing Effectiveness
Dealers can maximize ROI and create strategies by tracking their advertising and automotive digital marketing effectiveness. Cost per lead measures the efficiency of efforts toward lead generation, while cost per acquisition assesses the total cost of converting new customers.
5) Evaluating Inventory Turnover & Aging
Metrics like average days to turn to measure how quickly vehicles are being sold, while average inventory age tracks how long vehicles remain in stock. Inventory aging analysis identifies slow-moving vehicles which helps improve the inventory mix to reduce holding costs and increase turnover.
Conclusion
To run a successful automotive dealership, it is necessary to keep an eye on KPIs. Dealers can get a clear picture of their financial health and market standing by tracking sales and revenue metrics. Using the KPI for automotive dealerships helps with making smarter decisions, run the dealerships smoothly, and grow in an effective way.